医学统计与R语言:生存分析中连续性变量optimal cutoff确定
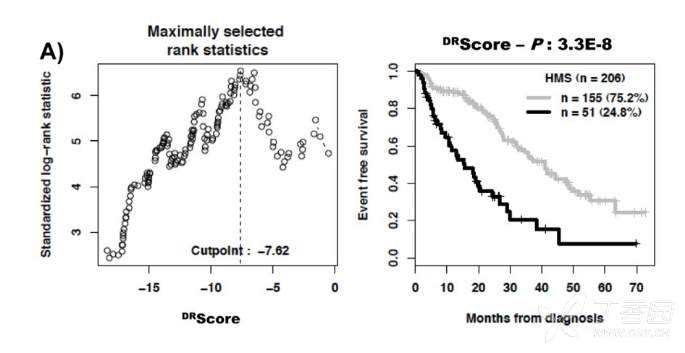
《Incremental Prognostic Value of Apparent Diffusion Coefficient Histogram Analysis in Head and Neck Squamous Cell Carcinoma》和《A DNA repair pathway score predicts survival in human multiple myeloma: the potential for therapeutic strategy》等论文中对生存分析中的连续性变量的optimal cutoff进行了确定,文章中的部分统计方法描述和结果截图如下:

如何通过R语言实现呢:
输入:
surdata <- read.csv("C:/Users/mooos/Desktop/surdata.csv")
str(surdata)
结果:
'data.frame': 95 obs. of 6 variables:
$ id : int 1 2 3 4 5 6 7 8 9 10 ...
$ group : int 1 1 1 1 1 1 1 1 1 1 ...
$ status: int 1 0 0 0 0 0 0 0 0 0 ...
$ time : int 186 6 78 180 224 196 207 242 216 86 ...
$ size : num 6.2 35.75 70 28.2 0.27 ...
$ hb : num 100 78 135 124 113 139 125 111 100 142 ...
输入:
install.packages("survminer")
library(survminer)
sur.cut <- surv_cutpoint(surdata, time = "time", event = "status",variables = c("size", "hb"))
summary(sur.cut)
结果:
cutpoint statistic
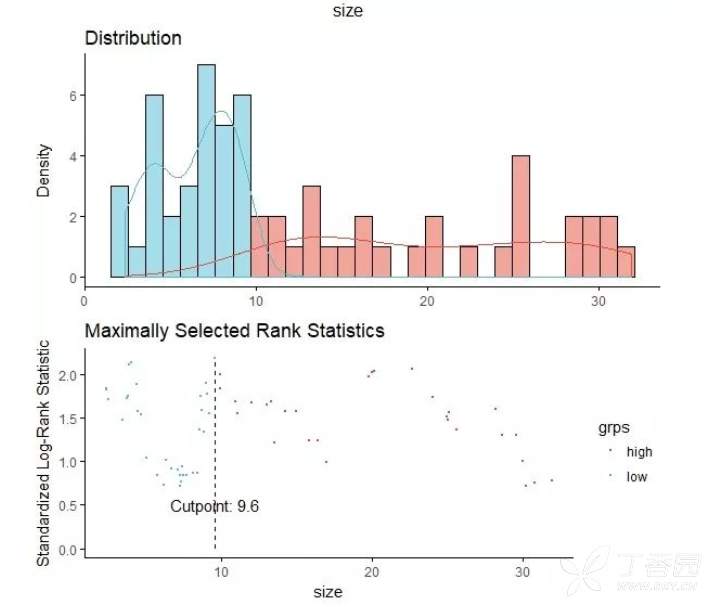
size 9.6 2.186425
hb 89.5 1.535561
#size的cutoff是9.6,hb的cutoff是89.5
输入:plot(sur.cut, "size", palette = "npg")
结果:
输入:sur.cat <- surv_categorize(sur.cut)
head(sur.cat)
结果:
time status size hb
1 186 1 low high
2 6 0 high low
3 78 0 high high
4 180 0 high high
5 224 0 low high
6 196 0 low high
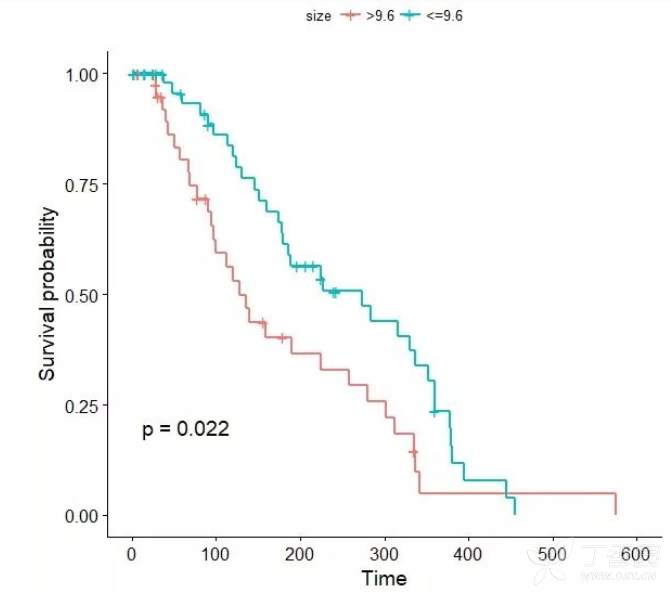
#将连续性定量变量size和hb按cutoff转为二分类变量
输入:
fit1 <- survfit(Surv(time, status) ~size, data = sur.cat)
ggsurvplot(fit1, data = sur.cat, conf.int = F,pval = T,legend.title="size", legend.labs=c(">9.6","<=9.6"))
结果:

(请扫瞄二维码关注公众号)


